


Complete Beginner’s Guide to Reading Crypto Charts
Cryptocurrency trading can be both exciting and difficult, especially for beginners. Understanding how to interpret cryptocurrency charts is a fundamental skill that determines your trading success. This comprehensive guide will teach you everything you need to know to confidently read crypto charts like a pro.
Table of Contents
Understanding cryptocurrency charts
Before delving into the intricacies of how to read crypto charts, it’s important to understand what they represent. Crypto charts visually represent the price movements of a cryptocurrency over a specific period. These provide valuable insights into market trends, price volatility, trading volumes, and more.
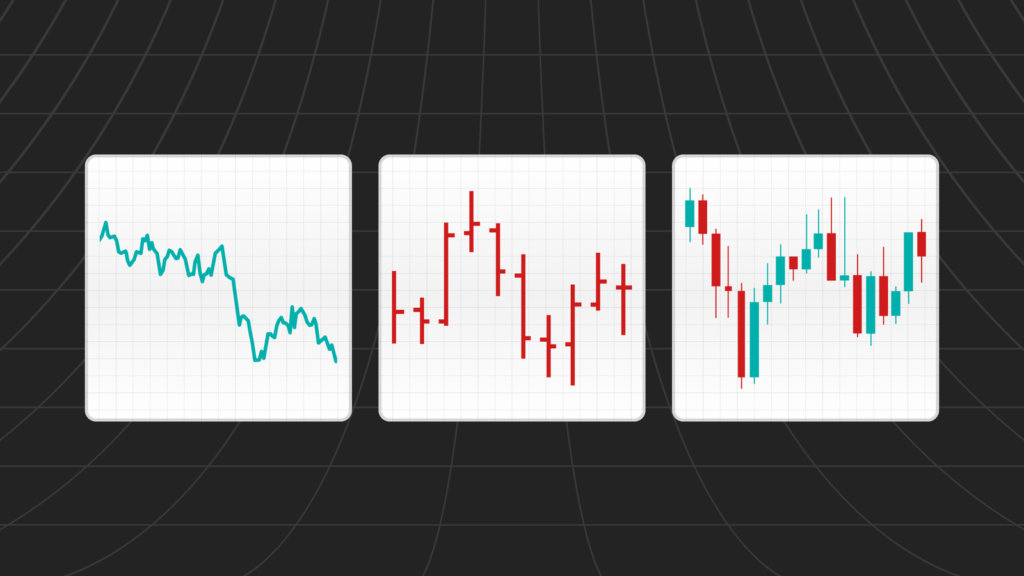
Types of Virtual Currency Charts
Line Charts: Line charts easily visualize price trends over time. Connect closing prices with a line to help identify general price movements.
Candlestick charts: Candlestick charts provide a more detailed view and show the opening, closing, high, and low prices within a specific time frame. Each candle represents a single time period, such as an hour or a day.
Bar chart: A bar chart displays the same information as a candlestick chart but in a different format. Use vertical lines to represent price ranges and horizontal lines to indicate opening and closing prices.
Key components of crypto charts
To effectively analyze cryptocurrency charts, you should be familiar with the following key components:
Price Axis: The vertical axis of the chart represents the price of the cryptocurrency, with higher prices at the top and lower prices at the bottom.
Timeline: The horizontal axis displays the analyzed time period and can range from minutes to years depending on the time frame of the chart.
Candlestick or line: Each candlestick or line on the chart represents price movement over a specific period of time. The color of the candlestick (usually green for rising prices and red for falling prices) indicates whether the closing price is higher or lower than the opening price.
Volume: The volume bar usually appears at the bottom of the chart and represents the amount of cryptocurrency traded in each period. High volume is often accompanied by large price movements, indicating strong market interest.
Interpretation of virtual currency chart
Now that you understand the basics, let’s take a closer look at how to effectively interpret cryptocurrency charts.
Identify trends: Look for patterns in price movements, such as B. an upward trend (price increase), a downward trend (price decrease), or a lateral trend (horizontal movement). Trends help you make informed decisions about when to buy and sell. Support and Resistance Levels: Support levels are price points where buying interest is sufficient to prevent further price declines, while resistance levels are price points where selling pressure prevents price increases. These levels can act as barriers that affect future price movements.
Use technical indicators: Technical indicators such as moving averages, relative strength index (RSI), and Bollinger Bands can give you further insight into market trends, momentum, and potential reversal points.
Consider time frames: Analyzing charts across different time frames (hourly, daily, weekly, etc.) reveals different perspectives on cryptocurrency price movements. Short-term traders may focus on shorter time frames for precise entries and exits, while long-term investors may prefer longer time frames to confirm trends.
Conclusion
Reading crypto charts is an important skill for anyone looking to navigate the volatile world of crypto trading. By understanding the different chart types, key components, and interpretation techniques outlined in this guide, you can make informed trading decisions and confidently navigate the complexities of the crypto market. It will look like this. Enjoy happy trading!
Please follow and like us: